The Hanging Man Candlestick Chart patterns are like a graphical dictionary in the complex web of financial markets, giving traders a sophisticated language to understand the continuous struggle between buyers and sellers. The Hanging Man is a unique candlestick formation that stands out among these patterns and may provide traders with clues about upcoming trend reversals. In this thorough analysis, we explore the complexities of the Hanging Man pattern, analyzing its components, comprehending its meaning, and discovering how shrewd traders use its signals to guide their decisions.
Understanding the Anatomy of the Hanging Man Candlestick Chart Pattern:
The Hanging Man is distinguished by its unique structure, comprised of a single candlestick that tells a story of market indecision and potential shifts in momentum.
- Small Body: The body of the Hanging Man is relatively small, indicating a period of indecision where neither buyers nor sellers have asserted clear dominance.
- Long Lower Shadow or Tail: The most distinctive feature of the Hanging Man is the long lower shadow or tail, extending beneath the small body. This elongated tail signifies that, during the trading session, prices experienced a significant dip but managed to recover by the session’s close.
- Upper Shadow: The upper shadow is generally short or even nonexistent, underscoring the idea that buyers were unable to drive prices substantially higher during the session.
Interpreting the Hanging Man:
The Hanging Man Candlestick Chart patterns is bearish often regarded as a potential reversal signal, particularly when it appears after a sustained uptrend. Its interpretation hinges on its position in the broader market context.
- After an Uptrend:A Hanging Man following a prolonged uptrend suggests that while buyers maintained control for an extended period, the session concluded with a struggle, as evidenced by the long lower shadow. Traders interpret this as a potential warning sign that the bullish momentum might be losing steam, hinting at the possibility of a trend reversal to the downside.
Signal Strength and Timing:
The effectiveness of The Hanging Man Candlestick Chart patterns signal is closely tied to its location within the overall price trend.
- Signal Strength: The Hanging Man Candlestick Chart patterns signal is strongest after a prolonged uptrend. This indicates the potential exhaustion of bullish momentum, making traders attentive to the possibility of a reversal.
Practical Example of a Hanging Man Candlestick Chart patterns:
Let’s walk through a scenario to illustrate the dynamics of a Hanging Man in a practical context:
- Scenario: Prices have been steadily rising, indicating a robust uptrend. A Hanging Man candle emerges, featuring a small body near the top of the price range and a long lower shadow.
- Interpretation: The small body signifies indecision, while the long lower shadow implies that, despite a significant dip during the session, buyers managed to push prices back up by the close. Traders perceive this as a potential cautionary signal, suggesting that the prevailing uptrend may be losing its vigor, and a reversal to the downside could be in the offing.

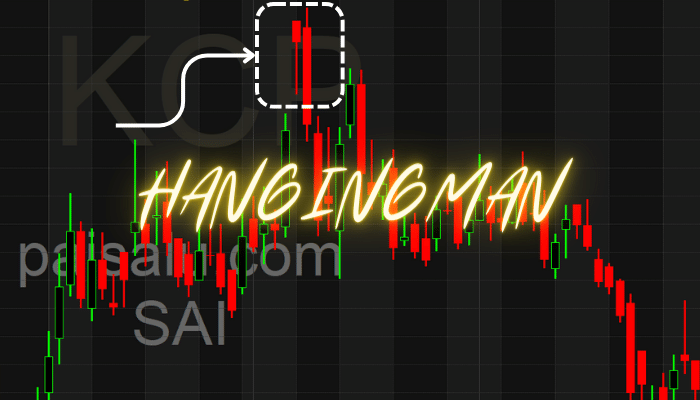
The Hanging Man Candlestick Chart pattern – KCP Daily Timeframe Chart
Using The Hanging Man Candlestick Chart patterns for Trading:
While recognizing a Hanging Man is a crucial skill, traders often exercise prudence and await confirmation before making decisions.
- Confirmation:Traders look for continued downward movement after the Hanging Man pattern. Confirmation may involve lower closes or a sustained increase in selling pressure.
Practical Tips for Traders:
- Combine with Other Indicators: Amplify the efficacy of the Hanging Man by incorporating it into a broader technical analysis framework. Consider other indicators and trends to provide a more comprehensive understanding of market dynamics.
- Risk Management: Implement sound risk management strategies, such as setting stop-loss orders, to navigate potential market fluctuations. The Hanging Man, like any pattern, does not guarantee outcomes, and risk management is crucial for preserving capital.
- Context Matters: Consider the overall market context, including support and resistance levels, to gain a deeper understanding of potential price movements. The Hanging Man’s effectiveness is enhanced when viewed in the context of broader market dynamics.
Conclusion:
The Hanging Man Candlestick Chart patterns appears as a significant signal in the dynamic and constantly changing world of trading, providing traders with an insight into the complex perform between buyers and sellers. This pattern enables traders to make well-informed decisions by signaling a possible reversal from an upward trend or acting as a warning. Like any other tool in a trader’s toolbox, the Hanging Man must be used strategically, taking into account other variables, indicators, and the larger market environment. Traders can effectively navigate the intricacies of financial markets by utilizing the Hanging Man pattern with practice and a thorough comprehension of market dynamics.
For More Personal Guidance On The Hanging Man Candlestick Chart patterns