Introduction:
In the dynamic world of financial markets, traders are constantly seeking effective strategies to make informed decisions and maximize profits. One such strategy involves combining Fibonacci retracement levels with exponential moving averages (EMAs) to identify potential buying opportunities in the stock market. This comprehensive guide outlines a step-by-step approach to implementing this strategy.
Step 1: Drawing Fibonacci Retracement Levels
The first step in this strategy is to identify recent price trends by drawing a Fibonacci retracement tool from the recent low to the recent high. This tool helps to highlight potential retracement levels where price corrections may occur. The key levels to focus on are the 38.2% and 61.8% retracement levels.
Step 2: Applying EMAs (Exponential Moving Averages)
Next, overlay three key EMAs on the stock chart: EMA 10, EMA 50, and EMA 200. These moving averages are widely used to smooth out price data and provide a clearer picture of the underlying trend.
- EMA 10: Short-term moving average that responds quickly to price changes.
- EMA 50: Intermediate-term moving average that offers a balanced perspective on recent price movements.
- EMA 200: Long-term moving average that helps identify the overall trend direction.
Step 3: Trading Above EMA 200
Ensure that the stock is trading above the EMA 200 level. This criterion filters out stocks that may be in a long-term downtrend, focusing on securities with a bullish bias.
Step 4: Identifying Retracement Points
Look for retracement points near the 38.2% or 61.8% Fibonacci levels. These levels often act as support during a retracement, signaling potential buying opportunities.
Step 5: Confirmation with Green Candle Formation
Wait for the price to touch the 38.2% or 61.8% retracement level and observe the formation of a green candlestick above these points. A green candle suggests that buyers are gaining control, supporting the idea of a potential reversal.
Step 6: Initiating a Buy Position
Once the conditions are met, initiate a buy position. Place a stop-loss order at the recent low to manage potential losses. This level serves as a safety net, protecting your investment in case the trade doesn’t go as planned.
Step 7: Setting Targets
Establish a target price above the recent high to capitalize on potential upward momentum. This provides a clear objective for profit-taking and helps maximize gains.
Step 8: Confirmation from EMA Crossover
For a stronger buy signal, look for a crossover between EMA 10 and EMA 50. This additional confirmation enhances the probability of a successful trade, adding a layer of technical analysis to support your decision.
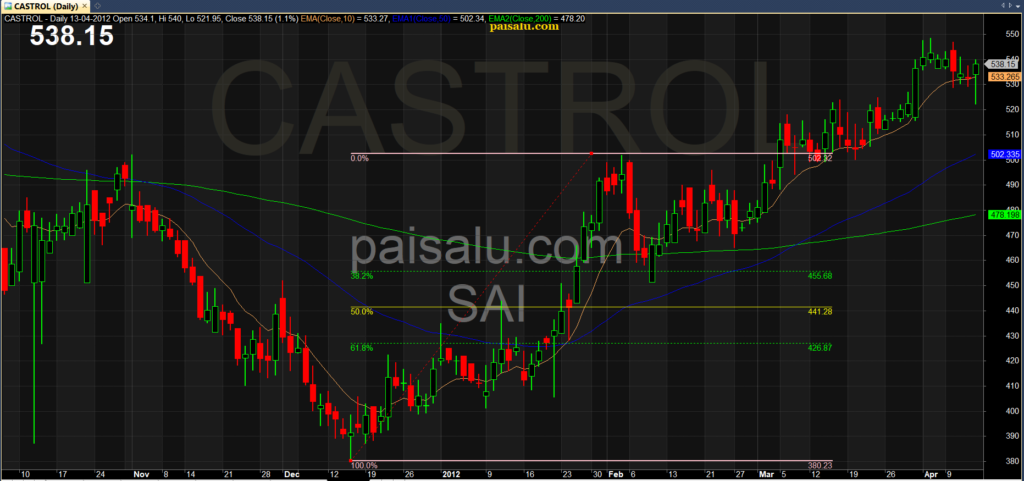
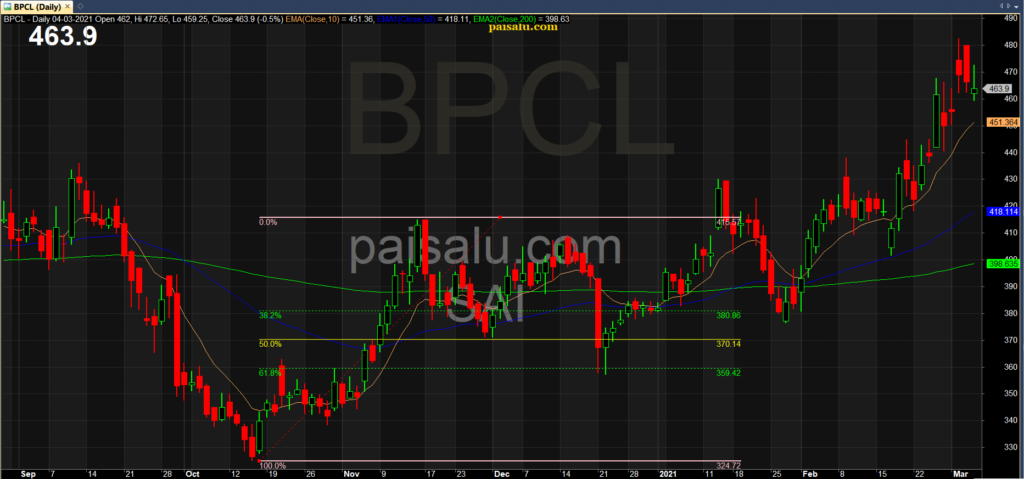
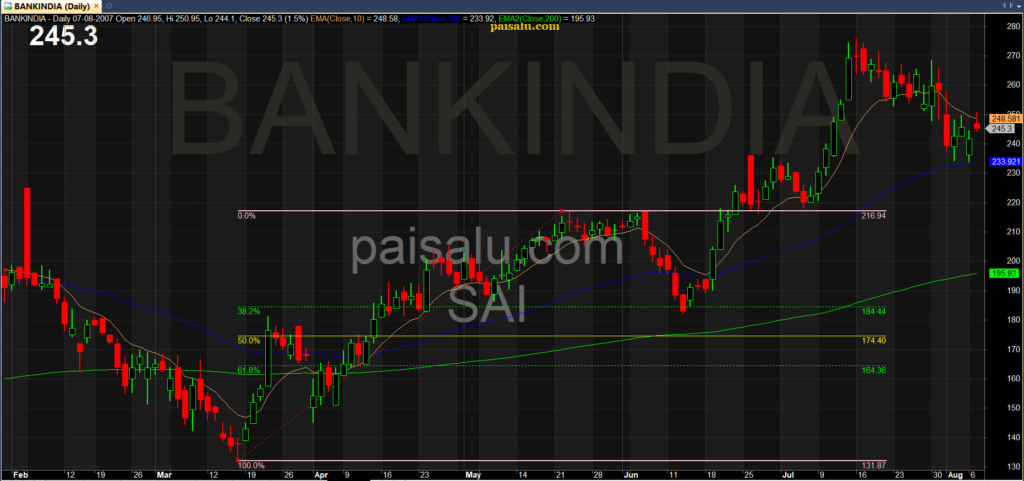
Live Examples : Suggested Time Frame – Daily Time Frame


Conclusion:
This Fibonacci and EMA-based trading strategy offers a systematic approach to identifying potential buying opportunities in the stock market. By combining technical analysis tools, traders can make more informed decisions, manage risk effectively, and potentially enhance their overall trading performance. As with any strategy, it’s essential to continuously monitor market conditions and adapt the approach as needed to stay ahead of evolving trends.
If you have any questions or uncertainties about implementing this strategy, feel free to leave a comment. I’m here to help!